
John Cherry, from Goodstart Early Learning, has written an evaluation of child care in Quebec and New South Wales. Apparently his purpose is to determine whether supply-side funded systems (like Quebec’s) are better or worse than demand-side funded systems (like in Australia).
To summarize briefly, John finds that Quebec does better on workforce participation and affordability, NSW does better on child care accessibility and quality. So, John concludes that Australia’s system is pretty good. His conclusion appears to be that Australia shouldn’t flirt with Quebec’s fixed-fee, supply-side-funded system.
It’s a problematic paper for several reasons. First, some of the details about Quebec are wrong. Second and more fundamentally, only part of Quebec’s child care system is supply-side funded and charges parents a fixed fee of approximately $10 a day. The other part (about 20% of the total) is demand-side funded like in Australia. In the demand-side-funded part, child care providers can set whatever parent fees the market will bear and some of this later gets reimbursed to parents. So, some of John’s comparisons, particularly on affordability and quality, are actually comparing a mixed system (Quebec) to a demand-side-funded system (New South Wales). These comparisons don’t tell us much about how a supply-side funded system would perform in Australia. Third, John does not explain how a demand-side funded child care system can deliver what we want from a universal child care system – dependably low fees, financial accountability for public funds, and planned expansion of capacity according to need. Let me explain.
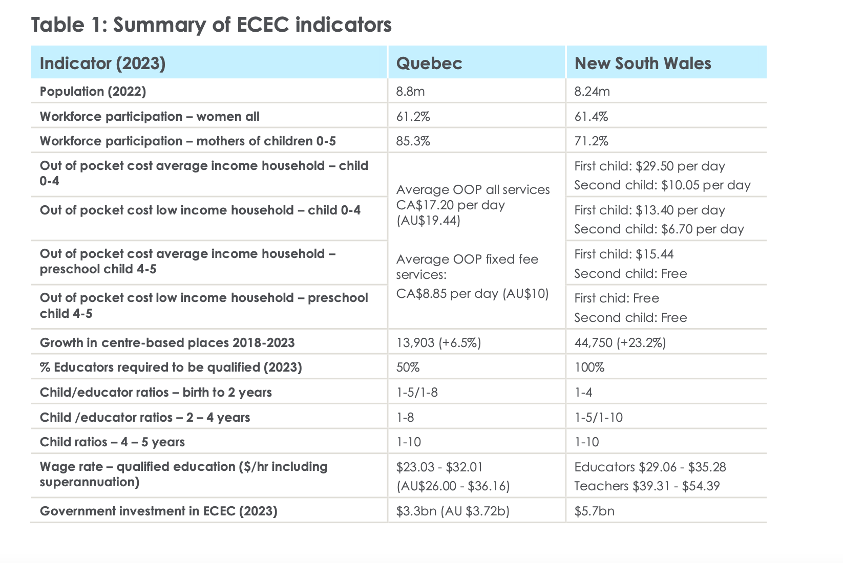
Much of John’s paper is captured in Table 1 – Summary of ECEC Indicators. There’s a column for Quebec and one for New South Wales, comparing results on different indicators of ECEC health. I reprint it below.
Workforce Participation
John agrees that Quebec does a better job than New South Wales in workforce participation. Absolutely true. 85% labour force participation for Quebec mothers with young children vs 71% in Australia. Add on top of that the fact that most Quebec mothers work full-time vs. Australian mothers mostly part-time and it does appear that a fixed low parent fee really does have a very substantial impact on mothers’ employment.
Affordability
John then presents comparisons of affordability, but his numbers are too generous to New South Wales and not generous enough to Quebec. The differences in parent fees between supply-side funding and demand-side funding are much bigger than he admits. On NSW, John calculates that for a family with average income, the parent fee for a first child is $29.50 per day and for a second child it is $10.05 per day. In fact, the Productivity Commission draft report says that the average per child out-of-pocket parent fee across Australia (and therefore likely in NSW) is just shy of $45 per day. That includes the extra charges for centres open more than 10 hours per day, where parents have to pay the full fee for these extra hours even though they don’t use them.
And the Quebec numbers on parent fees are too high. In the supply-side funded centres and family homes, the daily fee for every child in 2024 is CA $9.10 (or about AU $10). The figure John quotes for Quebec of CA $17.20 per day includes the children who pay $9.10 but it also includes the high parent fees paid by demand-side funded parents before the tax credit reimburses them. In a fair comparison, Quebec’s child care is cheaper than in NSW by a considerable amount, not just by a little bit. That helps us understand why mothers’ employment has been so responsive in Quebec.
Accessibility
Then there is accessibility. According to John, NSW scores high on accessibility of child care. But, he chooses a strange way of measuring it. He chooses the growth in the number of centre-based child care spaces in the last 5 years. NSW has added more child care spaces so therefore he concludes that accessibility is better in NSW.
A much better measure of accessibility would have been the coverage rate – what percent of the child population could be accommodated in approved services (licenced services in Canada). John provides these numbers on page 6 of his paper, but not in Table1 and not in his conclusions about accessibility. In fact, as he records, about 75% of children 0-5 in Quebec are in early childhood services. This compares to about 60% in New South Wales. John makes a big deal about services growing in New South Wales and not growing in Quebec. Of course, that’s what you would expect if accessibility was already better in Quebec; it wouldn’t need to grow its services as fast. The current rate of growth of services is not a good measure of current accessibility.
And if you compare the number of days of child care attended in Quebec and NSW, the accessibility in Quebec is even stronger. Over 90% of the children in Quebec who attend ECEC do so on a full-time basis, compared to about 30% in Australia (with another 25% in Australia attending 4 days a week).
Quality
Finally, we get to a part of the comparison between Quebec and NSW on which John and I agree. The quality of child care in Quebec is lower than it should be, and probably is lower than it is in NSW. The most obvious indicators of this are the child-staff ratios. 5 children to 1 staff member for very young infants in Quebec vs. 4 to 1 in NSW. Personally, I think both of these ratios are too high for the very young, but I agree that a 5 to 1 ratio is shocking. As is a ratio of 8 to 1 in Quebec after children turn 19 months of age.
Quebec is an outlier here in Canada too. In Ontario, the required ratios are 10 children to 3 staff members for children 0-17 months, 5:1 for children 18 months to 35 months, and 8:1 for children 3 years to 6 years (except for before-and-after school care for kindergarten children). NSW’s ratios are comparable to Ontario’s.
Similarly, the wage rates paid to educators in Quebec are worse than in New South Wales. John is right on this.
John overstates the differences in percent of educators required to be qualified. He says it is 50% in Quebec and 100% in New South Wales. The regulated percent in Quebec is really 66.6% or 2/3rds. It was temporarily lower due to staff shortages during the pandemic. And the requirement in NSW is for 100% of front-line staff to be certified. But this is a bit misleading because only 50% of the front-line staff in NSW must have an ECE Diploma or above. The other 50% can have a Certificate III which is a qualification well below what is needed to provide good quality care for children on one’s own.
However, the inadequate quality of Quebec’s child care system is not really evidence that supply-side funding does not work. Instead it is evidence that Quebec services have not been adequately funded. The history of Quebec’s system explains this. Back in the 1990s, Quebec struck out on its own to build a universal child care system, without any funding from Canada’s federal government. Relying only on its own funding, Quebec ended up cutting corners on quality. If New South Wales were operating either a demand-side funded or a supply-side funded system with no Commonwealth funding – relying only on state funds – I am sure that quality would suffer too. But Quebec’s history is not New South Wales’ inevitable destiny. With strong Commonwealth commitment to spending on universal child care, New South Wales can have both supply-side funding and good quality care. As you can see in John Cherry’s Table 1, public funding of child care in New South Wales is already 50% higher than in Quebec – AU $5.7 bn vs. AU $3.7 bn annually.
What Conclusions Should We Draw From This Comparison?
I understand John Cherry and Goodstart’s hesitation about a switch to supply-side funding. It would be a big transformation of funding arrangements and would constrain the power of child care operators to set their own fee levels. If it was done badly, it could have negative effects.
However, I think John and Goodstart need to explain how they will build a publicly-accountable universal low-fee high-quality child care system on Australia’s existing demand-side funding base. In my opinion, they need to answer (at least) three questions. How would they guarantee that the system will have low child care fees in the future? How can they build financial accountability for public funds into the existing system? And, what mechanisms of public planning for location of new services can ensure an equitable and efficient growth of new services in Australia?
Australia has seen parent fees rise consistently as public funding has increased over the years. The average parent fee per child is now about AU $135.00 per day. Every time the Commonwealth government pours more money into the system, out-of-pocket child care fees fall temporarily. After a short while, these out-of-pocket costs gradually rise back to previous levels. Nothing has worked to keep fees down in the long term. Supply-side funded systems guarantee low dependable out-of-pocket fees. Until Australia’s demand-side-funded child care system can provide the same guarantee, it cannot be considered a good basis for a universal system.
In a universal child care system, the vast majority of operator revenues come from governments. It is unacceptable to continue to have no public accountability for these substantial amounts of public funds. Currently, child care operators do not have to justify the fees they charge or show that public moneys are spent on legitimate costs of service provision. Goodstart should explain how this will be remedied in their plans for a universal child care system built on the existing demand-side foundations.
Finally, an equitable universal system of child care services needs to plan where new child care services will be located. It cannot leave this to the whims of private investors who all want to crowd their new services into higher income areas. How will this be accomplished within Australia’s demand-side funded system? These are the tough questions that need to be answered by the champions of a continuation of demand-side funding for Australian child care.